
 PDF Index
| SDT-visc
Contents
Functions
PDF Index |
Purpose
Material function for support of viscoelastic materials
This function is part of the viscoelastic tools.
Syntax
out = m_visco('command',model);
Description
Viscoelastic materials are described by a structure with fields
| .pl | Reference elastic properties used for initial model assembly. This should include the loss factor. |
| .name | Reference name for the material. |
| .type | Always set to m_visco since this is the material handling function. |
| .unit | Unit system see fe_mat convert. |
| .T0 | Reference temperature. |
| .G | Description of the modulus as a function of frequency. This can be a matrix with three columns giving frequencies, real and imaginary parts of the modulus, or a string that will be evaluated to determine the modulus. To sort frequencies use mat.G=sortrows(mat.G). |
| .at | Description of the frequency shift as a function of temperature. This can be a matrix with two columns giving temperature and frequency shift αT, or a string that will be evaluated to determine the shift factor. |
| .nomo | is a cell array containing information need to create the nomogram. See details under the nomo command. |
Accepted commands are
These commands are used to select materials. Info lists available materials. Default gives the first material. m_visco searches its own database and for mvisco_*.m functions in the MATLAB search path. The mvisco_3m function is given to illustrate the contents of a user database file.
To start a selection process use cf=feplot;m_visco('database',cf). This will give you a list of materials in the database. In the Mat tab, select materials you want to see, use the delete key (or the Remove material ... context menu) to remove entries. You can also add materials to the stack manually with
m_visco('database -unit TM Densil',cf);
m_visco('database -unit TM Smactane 50_G',cf);
By default, the maximum loss factor and associated modulus and frequency are displayed for the material reference temperature. You can order the list by giving a target InfoTarg freq temp sort (frequency, temperature, sort by modulus 1 or loss factor 2). Thus
>> m_visco('info wtarg 30 ttarg=20')
     CorningGlass0010   (G 2.87e+009 Pa e 0.02 3.00e+001 Hz 20 C)
ChicagoVitreous-CV325   (E 1.03e+008 Pa e 0.06 3.00e+001 Hz 20 C)
    Soundcoat-DYAD609   (G 6.21e+008 Pa e 0.08 3.00e+001 Hz 20 C)
   BarryControl-H-326   (G 5.90e+006 Pa e 0.08 3.00e+001 Hz 20 C)
...
You can also select your material by opening an feplot figure with all materials and selecting graphically. The InfoTarg command can then be used to select materials in a plots. For example giving a target frequency and a range of temperatures is achieved with
cf=feplot;cf.mdl='reset';
m_visco('database',cf);% open FEPLOT figure with database
RO=struct('wtarg',20,'ttarg',[-10 5 20 40 60 80]');
mat=[stack_get(cf.mdl,'mat','#ISD'); % Get selected materials
     stack_get(cf.mdl,'mat','#Smac')];
cf.mdl.Stack=mat;
% Once you have all desired entries, redraw
m_visco('info -modmin 1e6 -etamin .2 -cf1',cf,RO);
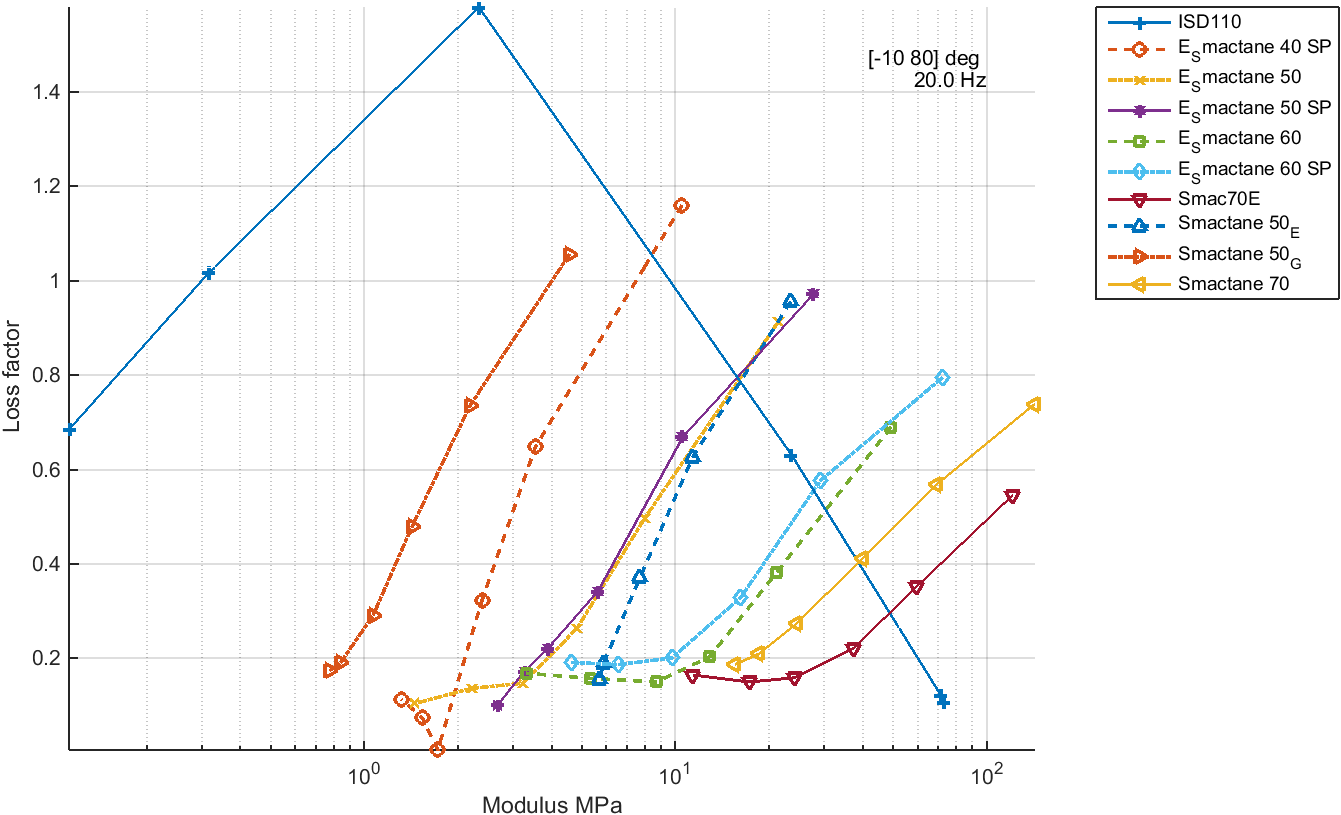
Figure 5.2: Material selection diagram.
mat=m_visco('database Name') tries to find an optimal match for Name in the database and returns the associated material. mat=m_visco('database -unit TM Name') converts to unit system TM (see fe_mat Convert). Command option -matid can be used to specify a MatId for the material. Without output argument material is added to the stack of the feplot figure (one can give the cf pointer as a second input argument). If Name is not given, all materials are returned.
mat=m_visco('dbval') is used to generate equivalent elastic materials. This is not currently functional.
The 3ParWLF material is a standard viscoelastic model with WLF type temperature dependence. Its constitutive law is the characterized by
| (5.10) |
The parameters retained to characterize this model are G0, etamax, wmax, c1, c2, T0.
m_visco('dispmat',mat) is used to generate a text display of a viscoelastic material describe by the mat data structure.
m_visco('refmat',mat,model) uses data on temperature range and frequency in the model to create a
The nomo command generates a standard nomogram plot. The following entries in the cell array mat.nomo are used. If using a mat.G table that contains raw experimental data that is non smooth, mat=m_visco('nomo -smooth',mat) will generate a smooth table.
| Eeta | gives the log10 of Emin,Emax,etamax. Note that for units in Pa, a shift to MPa is performed in the plot. |
| w | gives the log10 of Wmin,WRmin,WRmax. Increasing Wmin shifts the show isotherms right. |
| file | gives the name of the bitmap file used to digitize the nomogram. When this file is in the current directory, the nomogram and the bitmap are overlaid. This allows editing of tabular values as described under fevisco handnomo. |
| T | is used to specify isotherm positions in the nomogram. |
For example
 m_visco('nomo','isd112 (1999)',4)
 mat=m_visco('isd112 (1993)');
 mat=sdsetprop(mat,'nomo','w',[-1 0 12],'Eeta',[4 8 2],'type','G', ...
  'unit','SI','T',[-20:20:120]);
 m_visco('nomo',mat)

Figure 5.3: Nomogram of the ISD112.
The at command is used to generate shift factor using calls of the form
at=m_visco('at',T,mat)
where mat can be a data structure or a string matched against the m_visco database.
The interp command is used to generate the modulus at arbitrary frequency-temperature design points using calls of the form G=m_mvisco('interp',w,T,mat) where mat can be a data structure or a string matched against the m_visco database. Accepted options are
For example
 w=logspace(1,3,100);  % default : cf.Stack{'info','Freq'} in Hz
 T=[0:10:50];          % default : cf.Stack{'info','Range'}
 mat=m_visco('isd112 (1993)');
 G=m_visco('interp -unit MM',w,T(:),mat);
 m_visco('interp ShowRange',w,T(:),mat);
 %m_visco('interp',cf,'MatName') is also acceptable
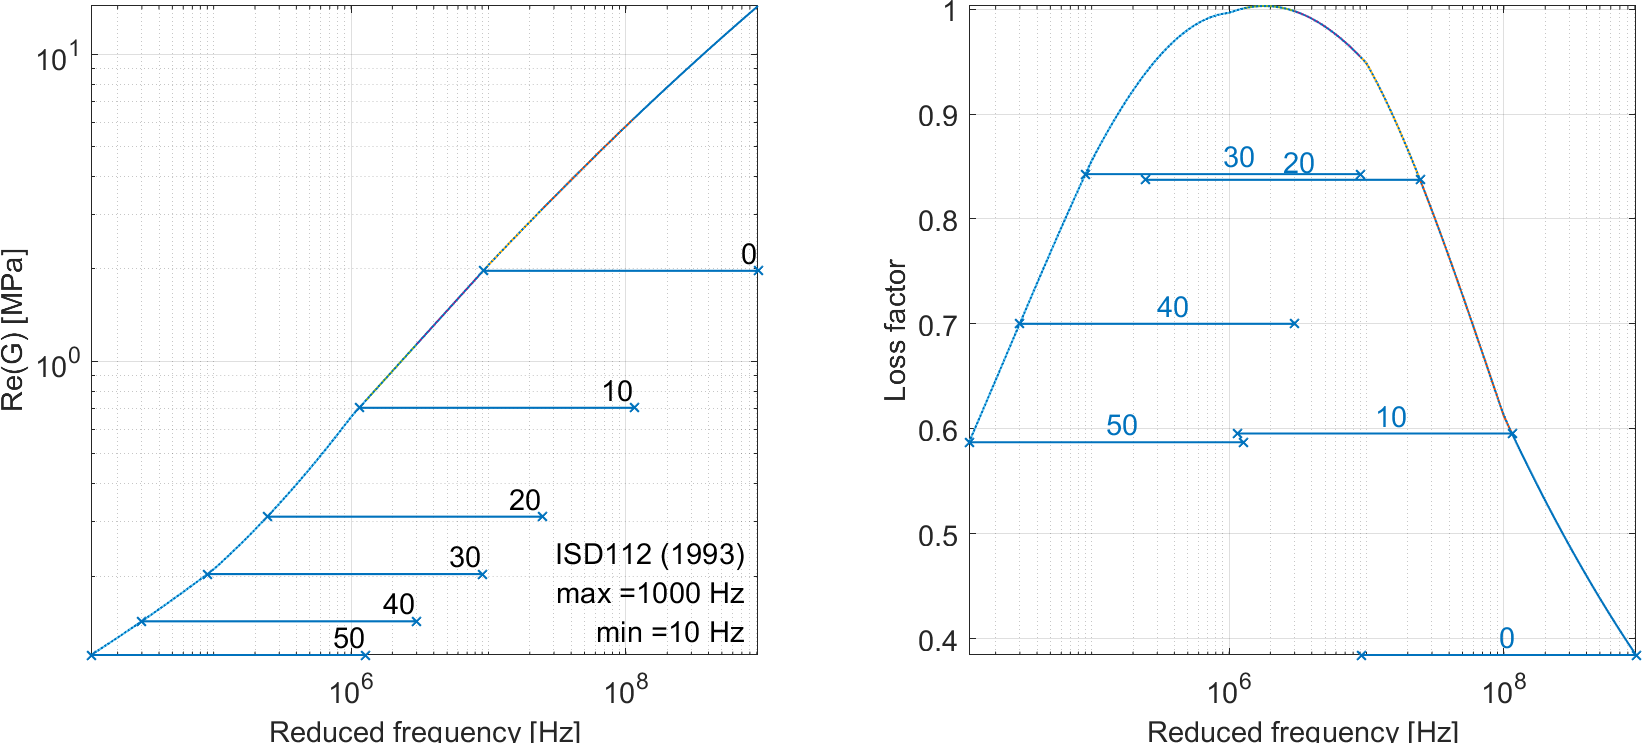
Figure 5.4: Modulus vs. frequency and temperature. Horizontal blue lines show the physical frequency range (indicated in the legend) at the temperature shown by the text.
This utility is meant to help users generate complex modulus tables for use in NASTRAN. The tables are generated as two TABLED1 bulk entries if only one ID is specified in the command, the real and imaginary parts are written with sequential numbers. The command specifies the table identifier (default 1) and file name. Note that this only supports a single temperature, since NASTRAN does not handle multi dimensional tables.
For more details on writing TABLED1 entries see naswrite WriteCurve.
 fname=horzcat(nas2up('tempname'),'.blk');
 m_visco(horzcat('WriteNastran 101 201',fname), ...
   10:10:100,10,'isd112 (1993)');
 type(fname)
Displays the bitmap image of a nomogram and guides the user through the process needed to obtain a tabular version suitable for inclusion in m_visco. The main steps of the procedure are as follows
If the isotherm slope is not correct, check the Elim and wlim values and possibly adjust the axis rectangle using : uU to move the rectangle along -x or +x; vV to move the rectangle along -y or +y; xXyY to resize the rectangle.
At any point during the procedure, you can press the i key to generate a screen printout of the material. This can then be included in m_visco or a mvisco_*.m database file.
With a material saved in a database, can superpose the original figure and the nomogram using m_visco('HandNomo MatName') while having the image file in the current directory.
See also

