
Undertaking vibration analysis, it is very common to characterize a system by its modes of vibration, realizing a modal analysis. In linear dynamics, the response can indeed be expressed into a series of decoupled modal contributions greatly simplifying the analysis.
Experimental correlation is best done by comparing modes. High level response (resonance) occurs when an excitation frequency is close to a mode, when any other contribution becomes small, so that modes can also be easily observed and measured.
Getting into more complex topics such as non-linearities, the response itself cannot be described by decoupled contributions, but the system linear modes can still be used to describe the response and characterize the system, with some adaptations. Using a limited number of mode shapes to describe the response can be called subspace projection, and is a classical method associated to model order reduction. Modal analysis as the procedure to characterize a system’s modes is thus a mandatory part when studying vibrations.
A mode is characterized by its frequency, damping and shape (associated deformation field). Looking for harmonic responses on a system, one defines an eigen value problem to resolve where frequency and damping are derived from the complex eigenvalue and the shape is the eigenvector. Modes are then ranked by increasing frequency, giving a natural order coherent with the usual solver schemes iterations.
When evaluating experimental correlation, considering design modification or robust design, many variants or configurations of a system are considered, whose differences are evaluated by the variation of their modal characteristics. Depending on the parameters, the mode can evolve in terms of frequency, damping and shape. Sometimes, modal density is low for the first modes so that the frequency variations are lower than the frequency difference between modes. In such case one assumes that modal order does not change and directly compares frequencies in order. In the general case however, when modes are close together, ordering can change and response recombination can occur.
Considering significant parameter changes, a modal shape can also significantly evolve. A comparison tool is thus necessary to ensure that the observation of a difference is not related to ordering or recombination problems.
This tool must also be scalable to tackle large systems (several million DOF) with many parameters (up to hundreds) sampled in large design of experiments (over 10,000 points). The simulations methods available at SDTools allows such DoE to be performed in competitive times and storage volumes (2 to 12h and 1 to 50 GB depending on the application), so that the post-treatments must scale!
I – Mode tracking concept: a matter of subspace belonging
Following a mode evolution as function of parameters is commonly called mode tracking. It consists in saving the modal index of the current configuration obtained when pairing to a reference configuration. As modal index can vary, pairing must be performed by comparing mode shapes – a task almost always performed using the MAC (Modal Assurance Criterion). Unfortunately, as useful, visual and popular the MAC can be, it has its own limitations. In particular, it is not suitable for mode tracking.
Its equation considers shape to shape comparison with the Euclidean norm:
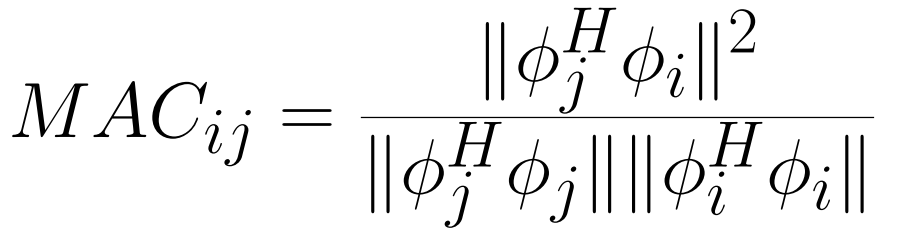
Firstly, the MAC is not a metric so that it cannot be used as a distance function and will thus be inappropriate as soon as the mode shapes vary. Secondly, it is not robust to recombination, in which case degraded results will be wrongly obtained.
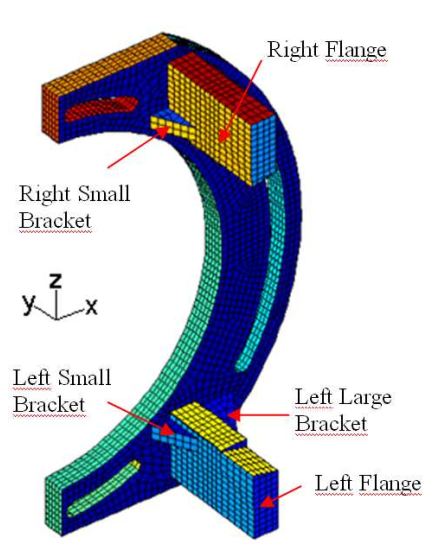
Modal recombination occurs within mode crossing or veering configurations. In this kind of setup, several modes are very close in frequency, so that changing a parameter value, or even little details can alter the result (imperfections in test parts, solver convergence, etc…). Ordering can change, but the eigenvectors can also get recombined, as when rotating a basis. To illustrate this pattern, we use a demonstration structure from [1], consisting in a symmetric bracket with two identical pillars. At some frequency, pillar bending will occur.
If the pillars are identical both bending modes will occur at the same frequency, making it a double mode. Pillar bending modes can then be expressed in different ways
- Either separated pillar bending
- Or in phase and opposed phase movements of both pillars.
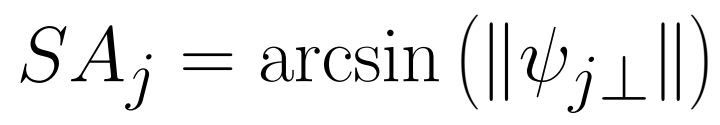
As soon as the modes get separated (design or construction tolerance) only separated bending can occur. This phenomenon is illustrated in the figure below, where pillar bending modes are separated by the left pillar height variation (using morphing).
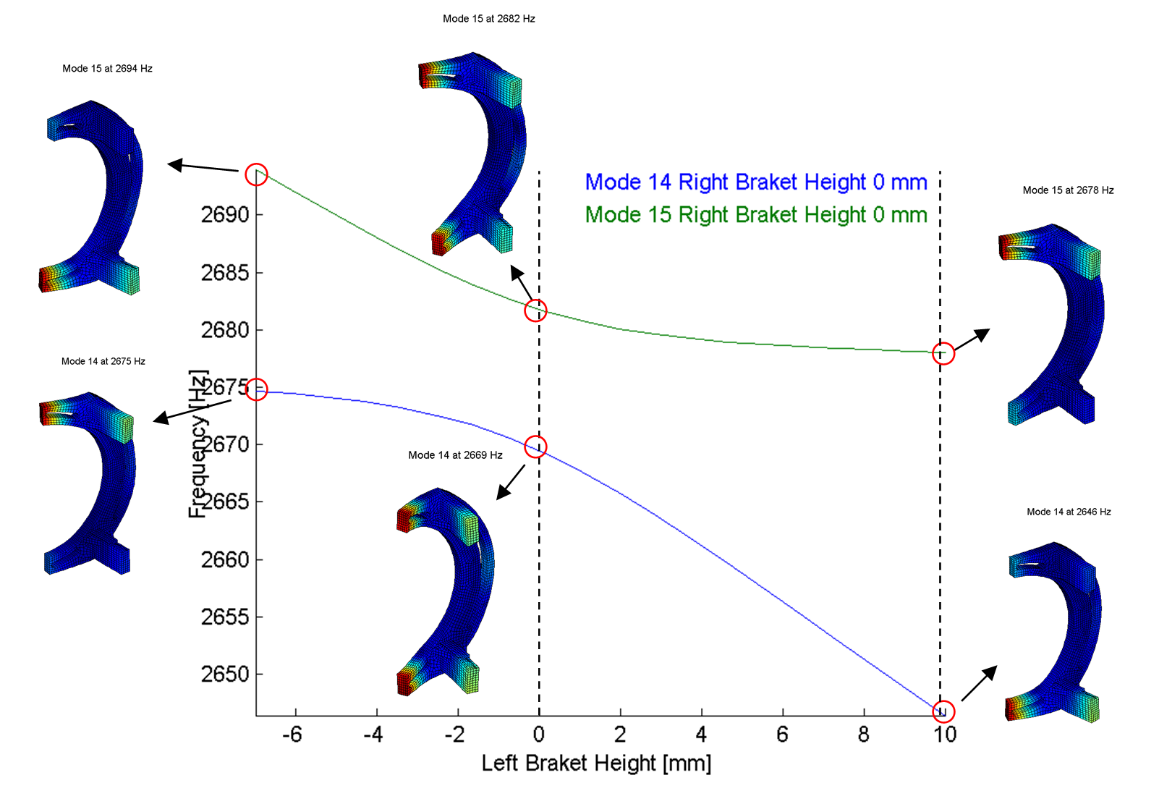
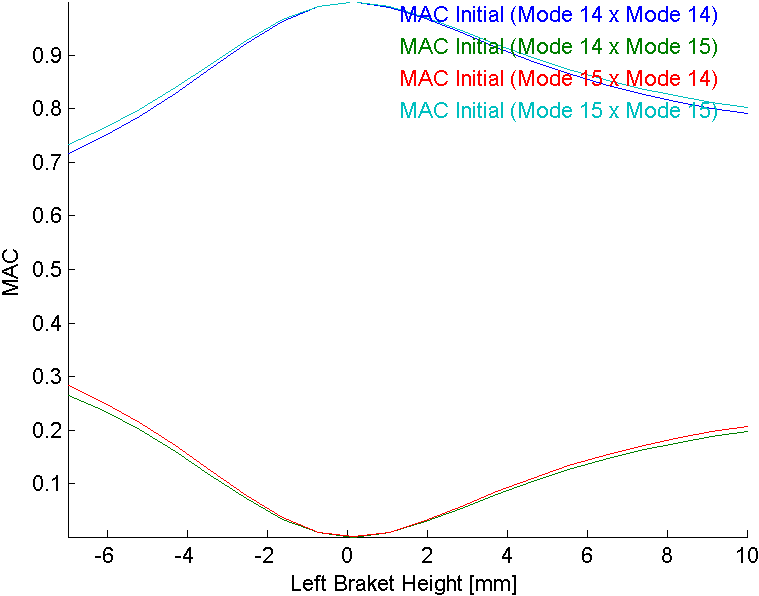
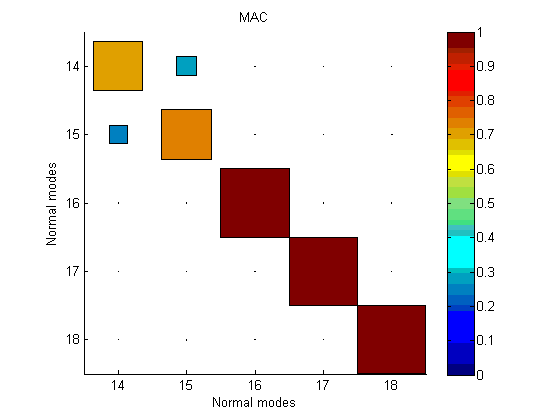
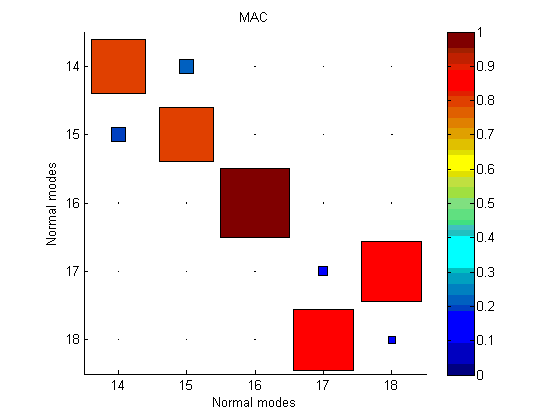
As the left pillar height gets from lower to higher than the right one, pillar bending modes order gets inverted. At similar height, the modes get combined. If one wants to track these modes with the MAC, the result gets as in the figure below. Inversion can happen that requires a pairing, but a degradation of MAC values is also possible. For example, if one recombines both pillar bending modes with uneven weights, the MAC will not match either reference mode. In such case tracking gets challenged. Usage tends to lower MAC thresholds to accept pairing but it seldom provides a robust solution.
As stated, the same mode shapes can be recombined in each configuration to reproduce the same deformation fields. The proper solution to track modal evolution in this case is thus to consider both shapes at once, forming a modal subspace.
To characterize a subspace evolution, one can measure the angle between the subspaces from two configurations. The notion of angle is a generalization of the dot product definition in 2D.
For a subspace spanned by a series of mode shapes stored in matrix Φ, any other shape can be decomposed into its projection to the subspace and an orthogonal part defined as
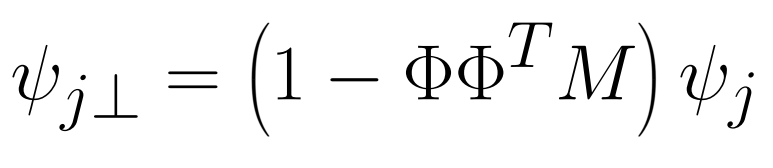
When working with reduced order models using mass normalized projection, the mass matrix is the identity, that simplifies this equation. The orthogonal part norm can then be interpreted as an angle to the subspace as
Using such a measure, a metric is defined, and the distance can help quantifying if the shapes are really different or just recombined. If shapes get dissimilar, a classification is required as discussed in the next section. If the subspaces are equivalent or if at least some shapes are similar a new recombination can be resolved with the Singular Value Decomposition (SVD) to provide an adapted pairing for which the MAC will work, enabling tracking.
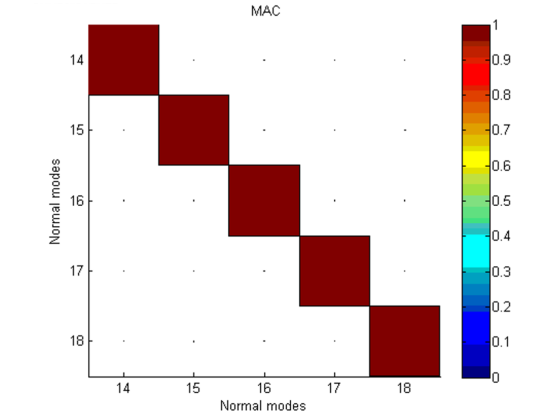
If subspaces are equivalent, one can reprocess initial MAC results to render a correct view associated to subspace being equivalent. The tested configuration can be replaced by its recombination so that the MAC becomes diagonal again, frequencies and damping can eventually be reevaluated on the system using the recombined shapes.
This feature is implemented in SDT with the -combine of our ii_mac function https://www.sdtools.com/help/ii_mac.html.
II – Beyond tracking: classifying modes with multiple shape coupling and numerous parametric dependencies
When complexity is increased, with for example multiple modes of interest, numerous parameters, significantly varying mode shapes, tracking modes becomes limited. Each mode shape shall not exist in every configuration, and multiple recombination scenarii can occur.
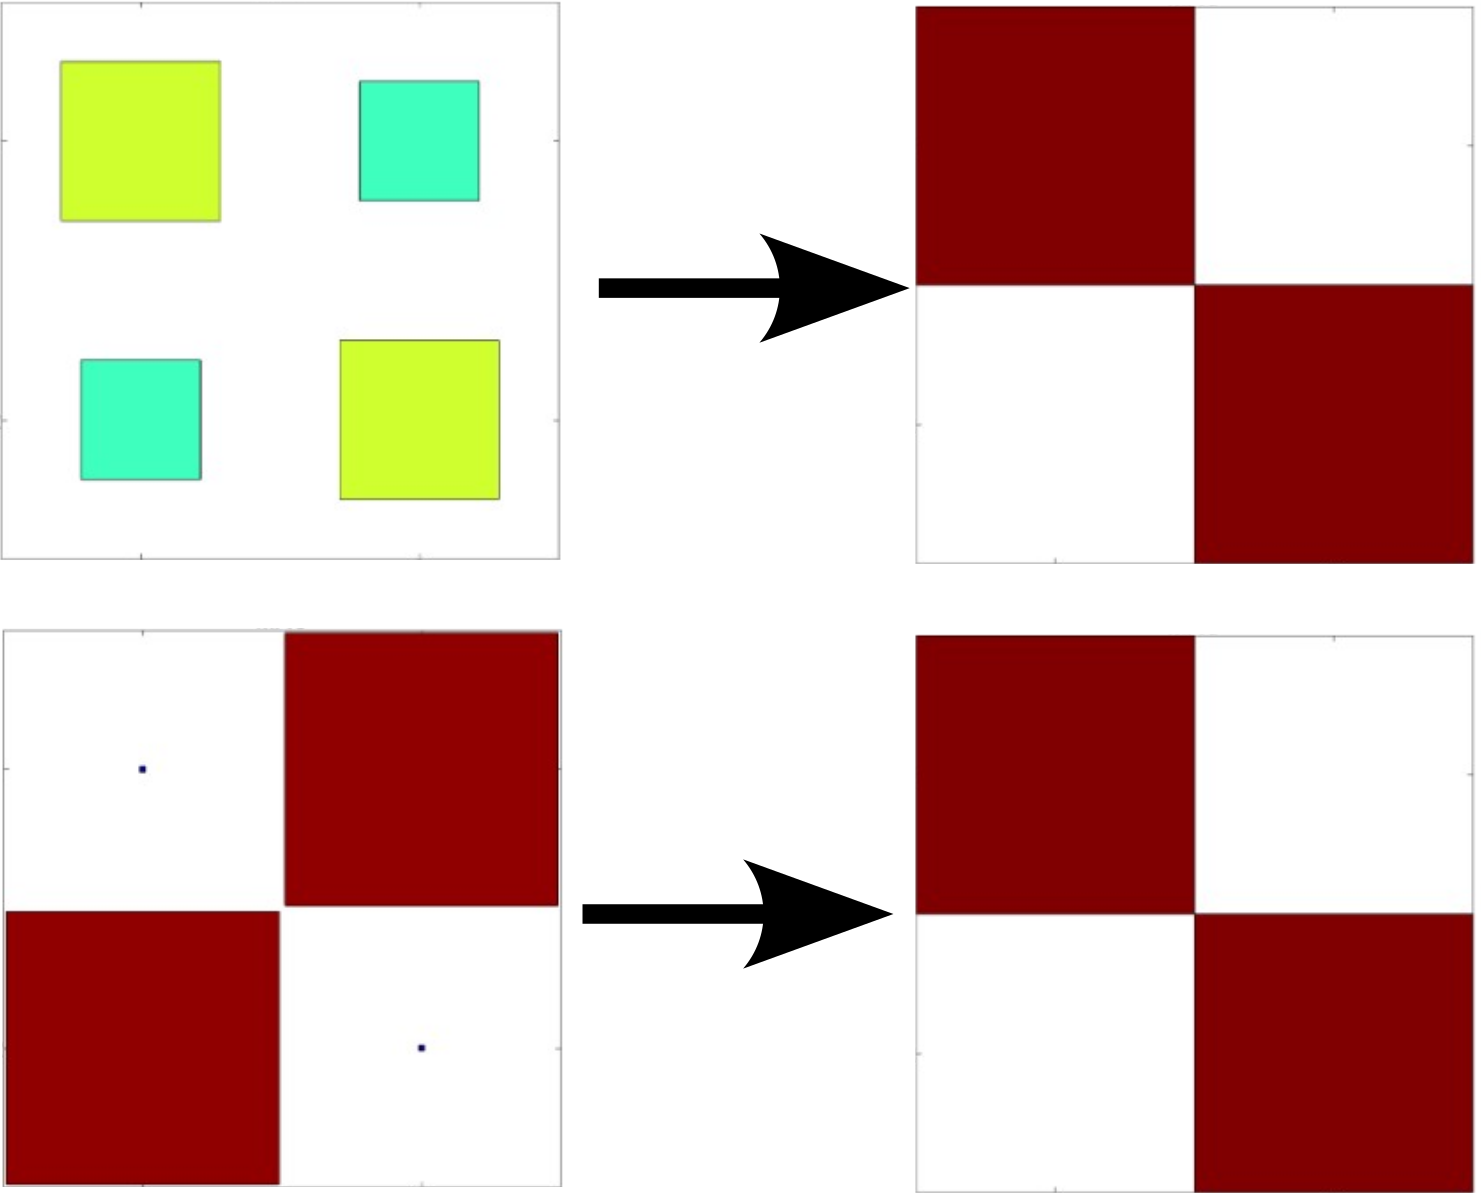
In the case of higher damping values, complex modes must be considered, that couple two shapes from their real and imaginary parts. Coupled shapes may differ depending on the configuration, so that subspaces may be partially matched. The notion of subspace angle then becomes critical to quantify the distance between two complex modes. In the figure below, the first complex mode in green exists in a plane spanned by its real and imaginary parts. The distance of the second complex mode in blue to the first one is estimated as the norm of its red part orthogonal to the green plane, that can be recast as an angle.
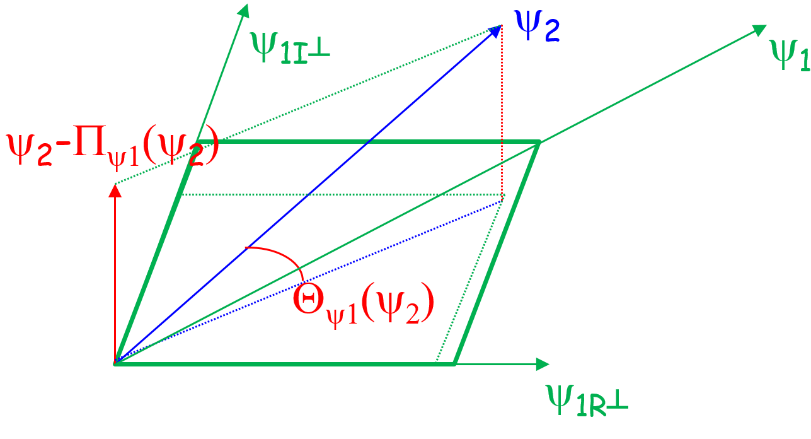
Since the subspace angle is a distance, clustering algorithms can be used to classify each mode into a given category. The k-means method is a typical method providing a classification of each mode shape of each configuration. The algorithm classifies all mode shapes from all configurations into k clusters so the variance in each cluster is minimized and the momentum between clusters is maximized. A typical classification result in 2D is provided in the following figure to illustrate the clustering objective. K-means is an iterative process dedicated to post-treatment.
Other cluster generation strategies can be devised to track modes depending on the need. When a reference configuration is chosen, tracking using subspace angle to classify new entries into the reference clusters is also possible, iteratively updating the cluster subspaces or not. Classifying a new shape into the existing clusters is also possible using k-nearest neighbors.
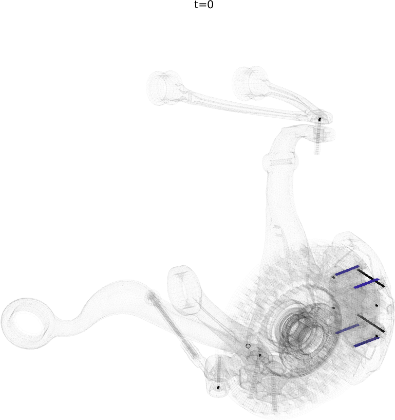
For an application example, a brake squeal study based on our EuroBrake 2019 presentation [2] in collaboration with Mercedes Benz is used. This study considers a vehicle front disc brake with suspension elements featuring 3 million DOF. One of the studies considered pad movement in the caliper so that the tangent coupling (partial sticking release) at every pad interface at once was varied. The DoE thus implemented a parametrized stick to slip condition transition at pad contact localizations shown below.
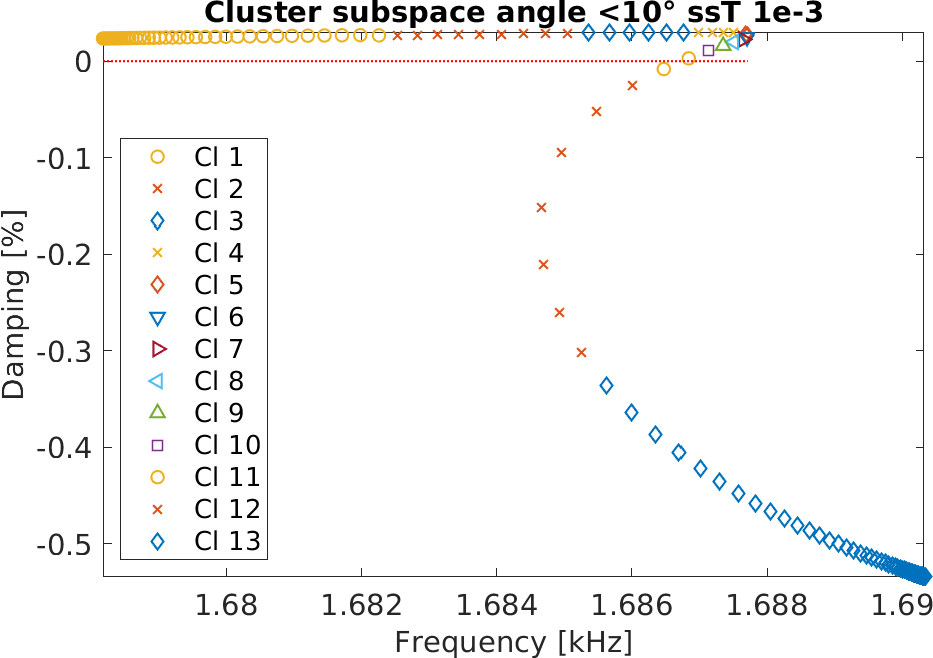
The study considered 200 configurations from fully sticked to fully sliding interfaces, intermediate states being similar to penalized sticking with a variation of the penalization coefficient. The study was fully realized in 2h. The target unstable mode showed the root locus trajectory below, but the mode shape itself varied a lot. Applying our classification algorithm, 13 clusters were found with a clear transition between the unstable ones (with negative damping) and the stable ones.
Analyzing the shapes associated to each cluster, the observed variation could be justified and clearly added value to the analysis. It could be found that every mode shape shared the same stator mode, but the coupling condition changed the coupled rotor mode explaining the stability transition.
Cluster mode shapes decomposed into real and imaginary parts
At a larger scale, classification is enabled, as in the brake squeal example below, out of 10,000 tested configurations among 10 parameters, 16 clusters were found in the frequency band of interest, 8 of which were unstable.
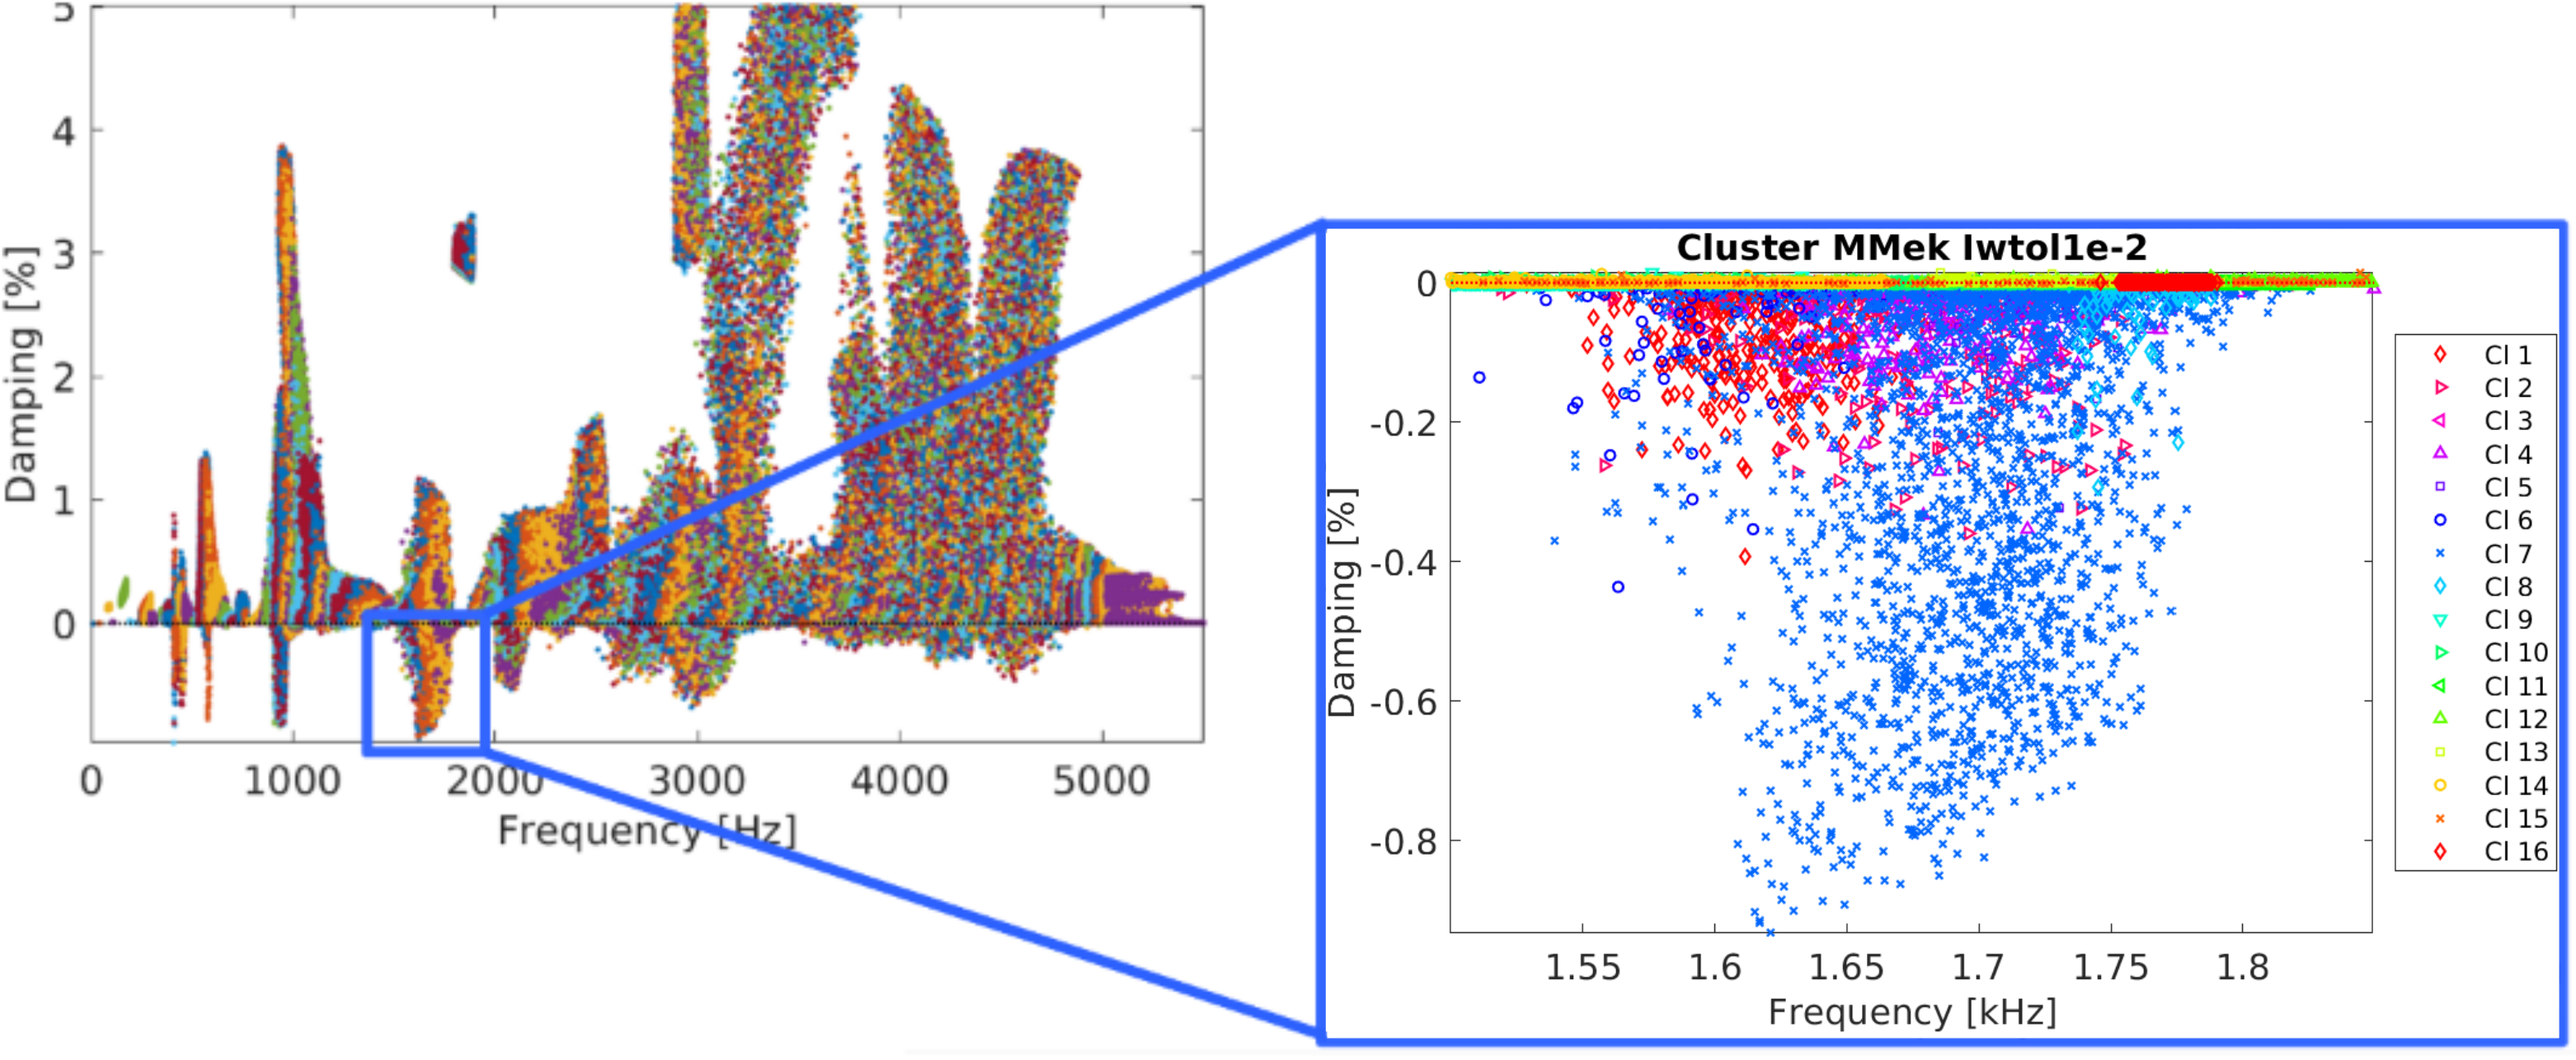
Of course, parameters from each cluster can be recovered, allowing any parameter regression or surrogate modelling strategy to be deployed.
III – Conclusion
Mode tracking is a very common need for structural dynamics projects. The concept is however challenged as soon as more than a few well separated lightly damped modes are under study: mode shape coupling, recombination and alteration can occur. Handling then becomes complex and can lead a study to a dead-end, by lack of adapted analysis tools.
In such case, advanced methods must be used, considering modal subspaces and associated angle distances. With the proper framework, robust mode tracking, and large-scale classification gets enabled, opening new perspectives on large scale parametric analysis.
References
[1] On the influence of geometry updating on modal correlation of brake components
B. França de Paula, G. Rejdych, T. Chancelier, G. Vermot des Roches, E. Balmes
Vibration Chocs et Bruit, 2012
[2] Efficient large multi-parametric squeal simulation and analysis using advanced model reduction tools
G. Vermot des Roches, O. Stump, E. Balmes, EuroBrake 2019
EB2019-SVM-006